Interact SSAS comes with countless reports and KPIs to enable the Social Security Administration to more effectively manage its operations and financial responsibilities. These reports include powerful audit reports to see which changes were made when and by who, comparison reports to find possible errors and spot non-standard changes in contributions or payments, and many reports to give a clear insight into the data that is being maintained by the SSA.
The following are some of the reports that will be produced by the system (each come with many parameters and filters and granular access control to manage confidentiality and all reports can be exported to Word, Excel and PDF):
1 Listing of all deceased Insured Persons
2 Employee Group Registration Details
3 New Registrants on E-Services
4 Inactive Users
5 Insured Population Number of Persons
6 Partial Pensioners under Caricom and Canada Reciprocal Agreement
7 Monthly Insured Population
8 New Employer Registration by Sector
9 Monthly IP Registrations by Entered/ Verified Officer
10 Self Employed Distribution of Registration by Industry
11 Employee SE VC Registrations by Age Group
12 Listing of all Insured Persons – By Name
13 List of all Insured Persons – by SSN
14 Registration of Employers – Statistical Data
15 Employment History
16 Registration of Insured Person – Statistical Data
17 Employer Registration Reports
18 Self-Employed Registration by Sector
19 Self-Employed Registration by Age Group
20 Self-Employed Registration by Class
21 Self-Employed Registration by Officer
22 Self-Employed Registration by Country of Birth
23 Self-Employed Registration by Industry
24 Self-Employed Registration Ranking by Industry
25 Self-employed Registration by Industry – Difference Report
26 Self-Employed Registration Monthly Change by Industry
27 New Registrations by Nationality
28 Registration Statistical Report
29 New Registrations by Country of Birth
30 Total New Registrations (Employer and Self-Employed) by Economic Activity
31 Total New Registrations (Employees) by Economic Activity
32 New Registration by Age Group and Sex
33 New Registrations – OECS Nationals
34 ER Ceased Employee by Industry
35 Insured Persons – Registrations Monthly by Age Group
36 Employee SE VC Registrations by Industry
37 Active Self-Employed Contributors by Industry & Island
38 Employer Registration by Industry & Island
39 Monthly Employment Average Weekly Wage per Job by Age
40 Monthly Employment Average Jobs Summary
41 Monthly Employment Difference in Average Jobs Summary
42 Monthly Employment Change in Average Jobs Summary
43 Monthly Employment Distribution in Average Jobs Summary
44 Monthly Employment Average Weekly Earnings by Wage Category
45 Monthly Employment Total Gross Wages by Category
46 Monthly Employment Rank in Average Jobs Summary
47 Weeks Worked by Industry & Gender
48 Doctor with Highest Number of Cases
49 User Status Report
50 Self-Employed report without business license
51 Insured Person – Registration Payments
52 Badge Requests
53 Employers who have not submitted contributions – by region
54 Top Employers Based on Total Arrears Amount
55 List of employers who defaulted on their payment plans
56 Unbalanced Schedules
57 Employer And SE Who Paid Nothing
58 Insured Persons Contribution Enter Details
59 Adjustments to Contributions and Receipts
60 Insured Persons with Multiple Employers Over $6500 in Monthly Wages
61 Listing of Notification Letters Sent to Employers on Over/ Underpayment of Contributions
62 Employers Who Submit Contributions from Overseas
63 Average Employer Contributors Per Month
64 Total Employer Payments by Industry & Island
65 Average Employer Payments by Industry & Island
66 Monthly Difference in Employer Contributions by Industry & Island
67 Quarterly Difference in Employer Contributions by Industry & Island
68 Monthly Difference in Employer Payments by Industry & Island
69 Quarterly Difference in Employer Payments by Industry & Island
70 Monthly Rank of Employer Contributors by Industry & Island
71 Quarterly Rank of Employer Contributors by Industry & Island
72 Monthly Rank of Employer Payments by Industry & Island
73 Quarterly Rank of Employer Payments by Industry & Island
74 Average Self-Employed Contributors by Age Group Gender and Island
75 Distribution of Average Self-Employed Contributors by Age Group Gender and Island
76 Total & Average Self-Employed Payments by Age Group Gender & Island
77 Distribution of Total & Average Self-Employed Payments by Age Group Gender and Island
78 Total Self-Employed Payments by Sector
79 Month & Quarter Wise Self-employed Contributors by Industry & Island
80 Month & Quarter Wise Self-employed Payments by Industry & Island
81 Change % in Month & Quarter Wise Self-employed Contributors by Industry & Island
82 Change % in Month & Quarter Wise Self-employed Payments by Industry & Island
83 Distribution of Month & Quarter Wise Self-employed Contributors by Industry & Island
84 Distribution of Month & Quarter Wise Self-employed Contributors by Industry & Island
85 Suspense Person by Employer
86 Productivity Listing of Contribution Detail
87 Productivity Listing of Contribution Summary
88 Insured Persons Aged 62+ Without Age Claim
89 C3 entries with Missing Social Security Numbers
90 Employers Reconciliation Statement – Summary
91 Employers Reconciliation Statement – Detail
92 Employer missing payment report
93 Employer short/ over payment details report
94 Additions to Delinquent Employers
95 IP list who paid Contributions as both EE and SE
96 Persons attaining Pensionable Age
97 Contribution Schedule Status
98 List of Unposted Schedules
99 C3’s Received Without Payment
100 Employer Contributions (C3) report
101 Insured Persons – New Registrations by Age Group & Sex
102 List of Active Employers by Industry
103 Insured Population Earnings by gender over the last 10 years
104 Active Insured Population by Migration
105 Active Insured Population by Marital Status-Migration-Education
106 Total Gross Wages and Salaries for each Establishment
107 Total Gross Wages and Salaries by Occupation Codes
108 Consolidated Insured Person Earnings Statement
109 Earnings Statement Insured Person
110 List of New Business by Industry
111 List of Public Sector Employers
112 Number of Self Employed by Occupation
113 List of Employers by Location Code
114 Social Security Contribution Filing Register
115 Social Security Contribution Payments Register
116 Average Weekly Earnings of Total Active Insured
117 Insured Person Not Submitted Claims Above Age 62 Years
118 Employees who did not submit filing report within Filing Period
119 Suspended Benefit Payments
120 Reconciliations Year-End Report
121 Earned Gross Wages and Earned Insurable Wages by Entity
122 List of Invoice Items
123 Self-Employed Contributions Count, Payment & Distribution by Industry
124 Self-Employed Contributions Count & Payment by Entity
125 Density Factors of Active Insured by Age and Sex
126 Active Insured by Sector
127 Insured Population – Density Factors
128 New Registrations & Active Employers
129 Self-Employed Contributions (FOR) by Industry & Island
130 Year-over-Year Difference in Self-Employed Contributors and Payments by Industry and Island (Monthly Comparison)
131 Difference in Self-Employed Contributors and Payments by Industry and Island (Quarterly Comparison) Report
132 Quarterly Rank of Self-employed Contributors / Payments by Industry & Island
133 Monthly Rank of Self Employee Contributors / Payments by Industry & Island
134 Active Employers by Economic Activity
135 Active Employers and Employees by Economic Activity
136 Active Insured Population
137 Contribution (Employees) by Economic Activity
138 Average Weekly Earnings of Total Active Insured
139 Average Weekly Earnings of Active Insured by Age Group and Sex
140 Active vs Inactive Insured
141 Active Wage of Active Insured
142 Density Factors of Total Active Insured
143 Average Insurable Wage by Economic Activity
144 Self Employed Contributors by Industry
145 Registration of Employers – Statistical Data
146 Self-Employed Payments by Age Group
147 Benefit Claims Report
148 Summary of Claims Logged-Office
149 Benefit Disallowance Details
150 Claims Entered by Officers
151 Benefit Status Report
152 Beneficiary Payment Details
153 Long Term Claims Processed/ Outstanding Over a Period of Time
154 All Claims with Adjustments Due to Short or Overpayment
155 Approved But Not Audited Benefit List
156 Employees Who Made Claims from More Than One Employer with Government Employer
157 Historical Number of Beneficiaries & Expenditure
158 Insureds of Benefit Awards
159 Benefit Claims by Illnesses Type
160 Social Security Benefit Payment Statement
161 Social Security Benefit Payments by Claim Type
162 Widow/er Eligible for One-Year Payments
163 Suspended Benefit Payments Report
164 Social Security Benefit Payments Claim Summary
165 Summary of Pensions Report
166 Summary of claims processed office
167 Claims allowed below minimum payment report
168 Early Retirement Claims Report
169 Survivors No Longer Be Eligible for Pension
170 Survivors Attaining Ineligibility Age
171 Reciprocal Pensions
172 Social Security Benefit Payments Register
173 Social Security Benefits Check Register
174 Social Security Benefits Payee Register
175 Lodgement Check Listing
176 Lodgement Deposit Listing
177 Beneficiaries Status Report
178 Certificate of Life
179 Survivor children whose benefit cycle has been completed
180 Survivor Pension with One-year payment
181 Persons in receipt of Age and Survivors Benefit
182 Sickness Benefit Approaching 156 days Report
183 Sickness Benefit Claimants Aged 60 and Above
184 Invalidity Pensioners Attaining Pensionable Age
185 Age Claim Received but not Processed at Retirement Age
186 Survivor Claims when Eldest Child Payment has been Completed
187 Survivors who receive multiple benefits
188 Benefit Claims – Lead time of processing
189 Claims Processed by Officers for period
190 List of Pensioners on Roll as at Date
191 Invalidity Pensioners Medical Review Dates
192 Insured Person in Receipt of Age/ Invalidity Benefit
193 Children who will attain 16 or 18 years by specific dates (Survivors)
194 Claim report with the time the claim is entered and date of settlement
195 Insured Person Not Submitted Claims Above Age 62 Years
196 Social Security Outstanding Benefit Claims Employer Report
197 Pensioners with missing payment
198 Insured Population Historical Insurable Earnings
199 Insured Population New Entrants Age Distribution
200 Injury Benefits Statistical Report
201 Sickness Benefit by Benefit Days and Sex
202 Sickness Benefit by Age Group and Sex
203 Maternity Allowance by Age Group and Average Duration
204 Maternity Benefit by Age Group and Sex
205 Maternity Allowance by Benefit Days
206 Invalidity Benefit
207 Injury Benefit Avg. Weekly Benefit and Avg. Duration by Age Group & Sex
208 Invalidity Pension New Cases
209 Injury Benefit by Economic Activity and Benefit Days Grouping
210 Injury Benefit by Age Group & Sex
211 Injury Benefit by Illness and Average Duration
212 Injury Benefit by Illness and Economic Activity
213 Injury Benefit – Average Weekly Benefit and Average Duration by Age & Sex
214 Injury Benefit by Days Grouping and Sex
215 Summary of Sickness Benefit
216 Survivors Pension
217 Survivors Pension by Age Group
218 Survivor Pension in Payment
219 Injury Benefit by Economic Activity
220 Invalidity Pension in Payment by Age and Sex
221 Average Weekly Age Pension (New Cases) by Age & Sex – Statistical Report
222 Invalidity Pensions in Payment by Sex and Age Group
223 Age Pension in Payment by Age and Sex
224 Funeral Grant by Relationship and Age Group of Insured
225 Sickness Benefit Claim by Age Group – Statistical Report
226 Illnesses With Highest Average Duration
227 Sickness Benefit by Average Duration by Age Group and Sex – Statistical Report
228 Most Common Illnesses – No. of Awards by Sex – Statistical Report
229 Most Common Illnesses- Total Awards and Average Duration – Statistical Report
230 Maternity Allowances and Grants – Statistical Report
231 Sickness Benefit by Average Weekly Benefit by Age Group and Sex – Statistical Report
232 Maternity Benefit by Age and Sex
233 Maternity Allowance Average Duration & Average Weekly Benefit by Age
234 Age Benefit by Age Group and Sex
235 Insured Population – Age Distribution in Valuation Year
236 Insured Population – Past Insurable Credits
237 Long Term Benefits Branch
238 Contribution Submit Without Payment
239 Employers based on Status
240 Delinquent Employers List
241 Individual Accrued Credit Details
242 Employers with an Arrear Amount
243 Top Employers Based on Employee Count Employee Turnover Avg Contribution Per Month
244 Refund Employee Requests Pending for Approval from Employer
245 Delinquent Employer’s Status Aging Report
246 Employers with Active Payment Plans
247 Employers with Consecutive NIL Returns (3+ Months)
248 Delinquency Defaulter Report
249 Employers Determined to be Inactive
250 Employers with Debts Report
251 Payments by Delinquent Employers
252 Employer’s Missing Payments
253 Employer’s Missing Payments Report- (Employers Who Paid At Least One Month)
254 Employer’s Contribution History Statement
255 Dormant Employers by Quarter
256 Delinquency Detail Report
257 Employees by Employer by Month
258 Employers Arrears Listing Report
259 Employers Arrears List Summary Report
260 Legal Action Notices by Employer Reports
261 Compliance Performance Report Collection Area wise
262 Employers Contributions Arrears/ Payables
263 Lawsuits by Employer
264 Debt Agreement Entered by Period
265 Employers Performance with Debt Clearance Agreements
266 Non-Payments on Debt Clearance Agreement
267 Debt Clearance Report
268 Audit Schedule Report
269 Debts Agreements entered by Employer
270 Audit Findings by Employer
271 Top Employers Based on Total Arrears
272 Report Of Contribution paid by employers
273 Legal Actions by Employer
274 Audit Actions by Employer
275 Employers Court Report
276 Delinquency Status Report
277 Collection Variance Report
278 Delinquent Employer’s Status Aging Report by Date
279 Debt Agreement by Period Approval
280 Registered Employers Not Paid Over Months
281 Top Employers Based on the Number of Times they were Litigated
282 List of Employers Presently under Litigation
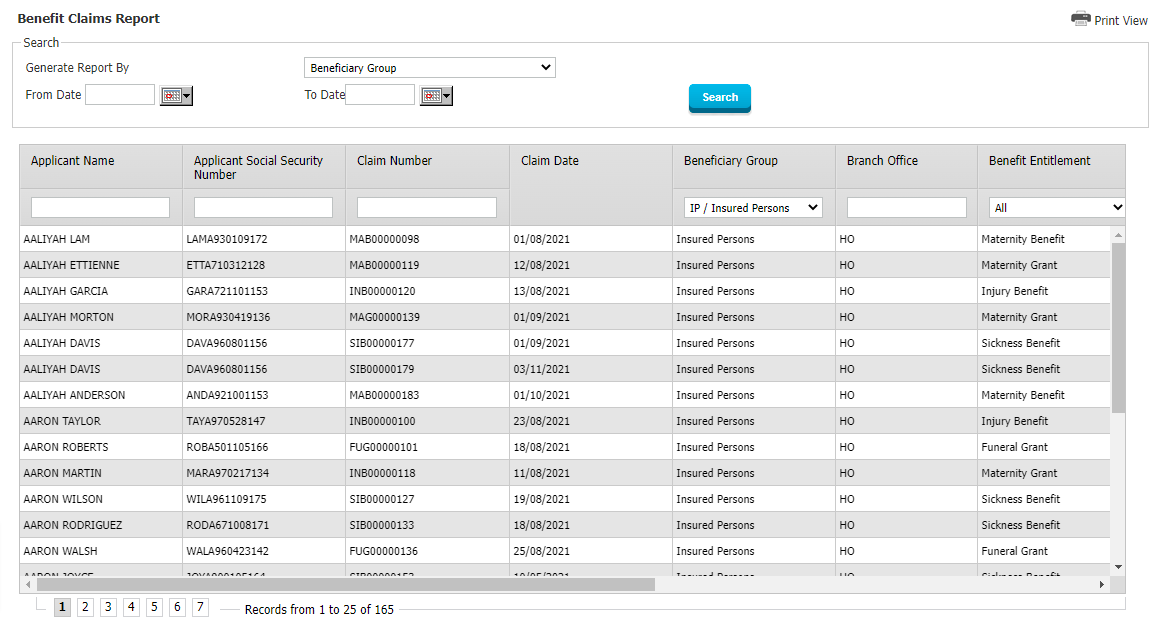
Figure 1: Claims and Benefit Reports – Benefit Claims Report
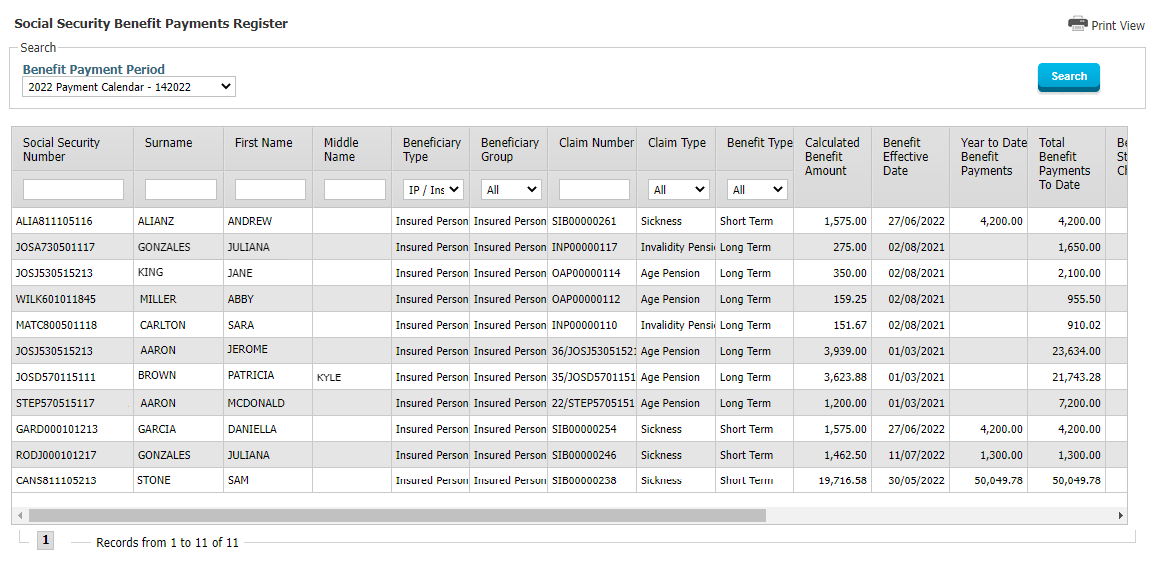
Figure 2: Claims and Benefit Reports – Social Security Benefit Payment Report
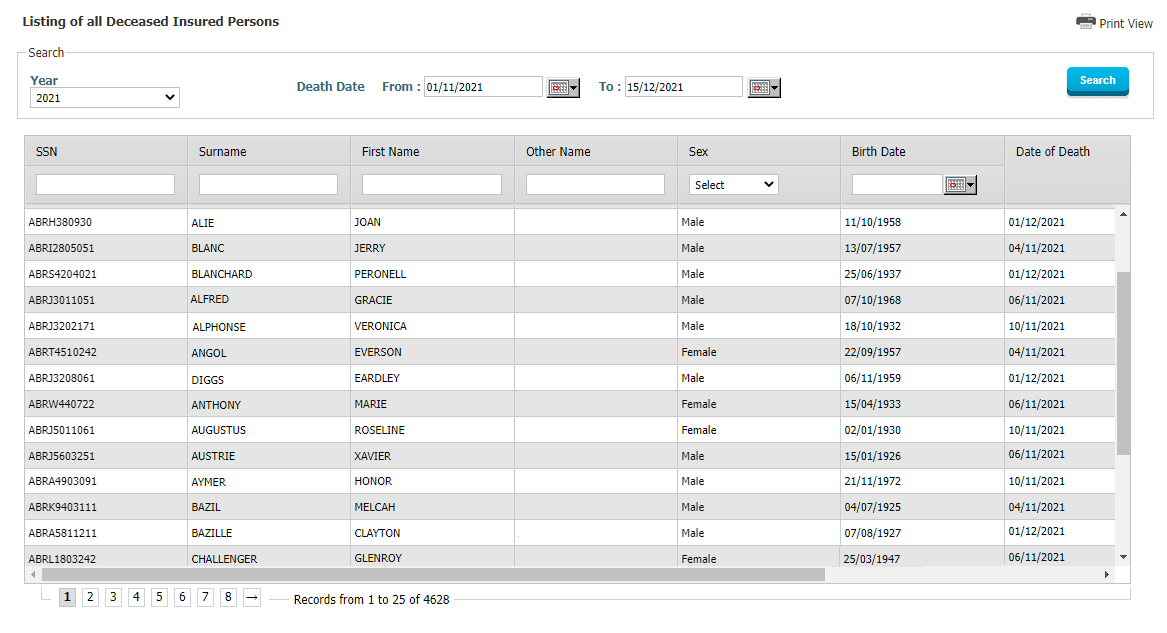
Figure 3: Registration Reports – Listing of all Deceased Insured Persons
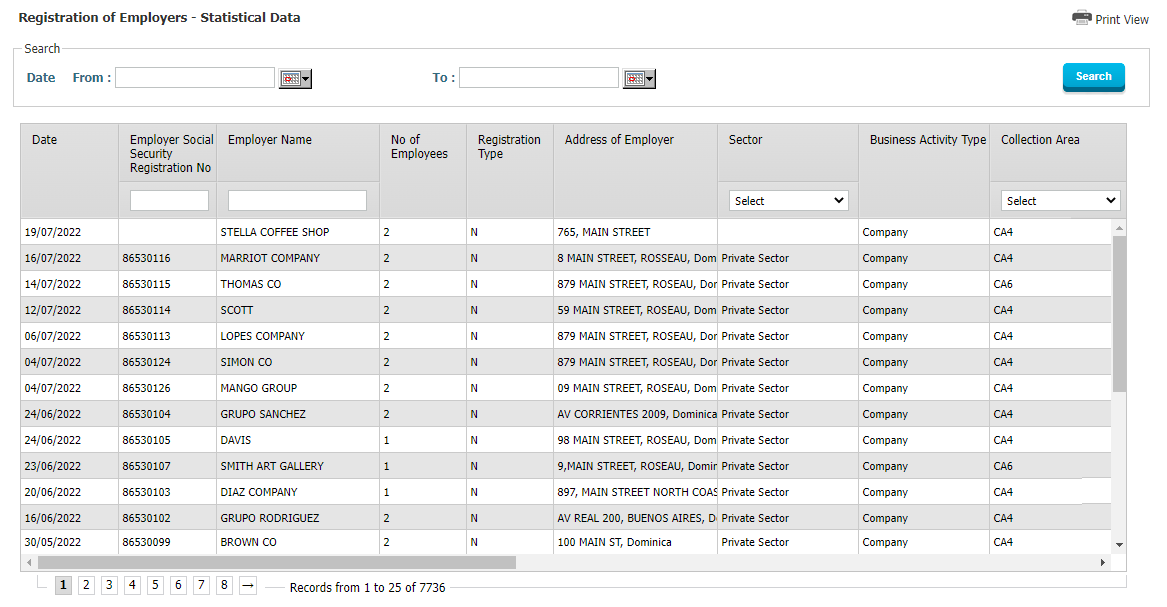
Figure 4: Registration Reports – Registration of Employers – Statistical Data
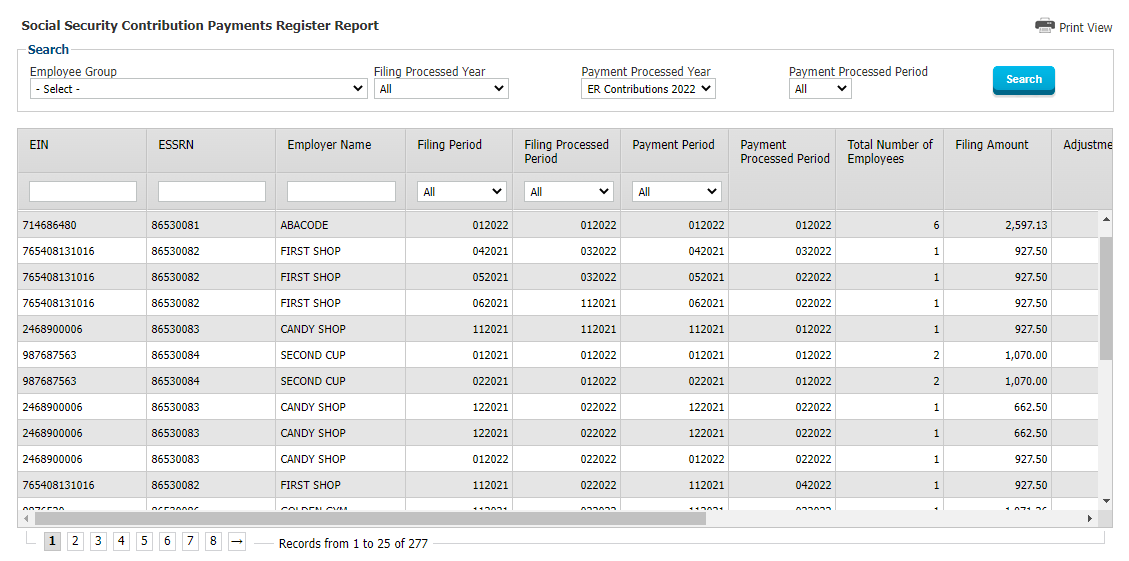
Figure 5: Contribution Reports – Social Security Contribution Payments register
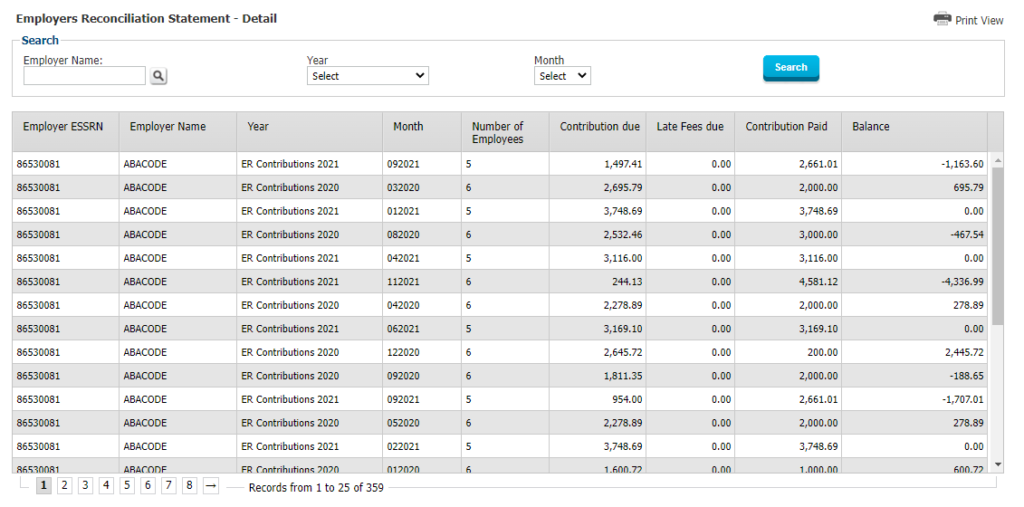
Figure 6: Contribution Reports – Employers Reconciliation Statement – Detail
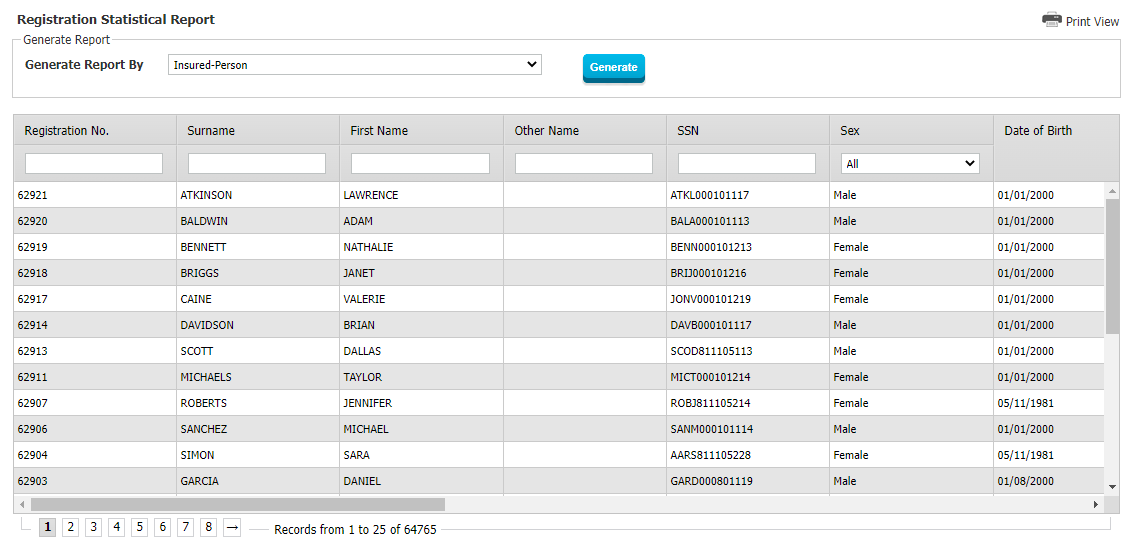
Figure 7: Statistical Reports – Registration Statistical Report
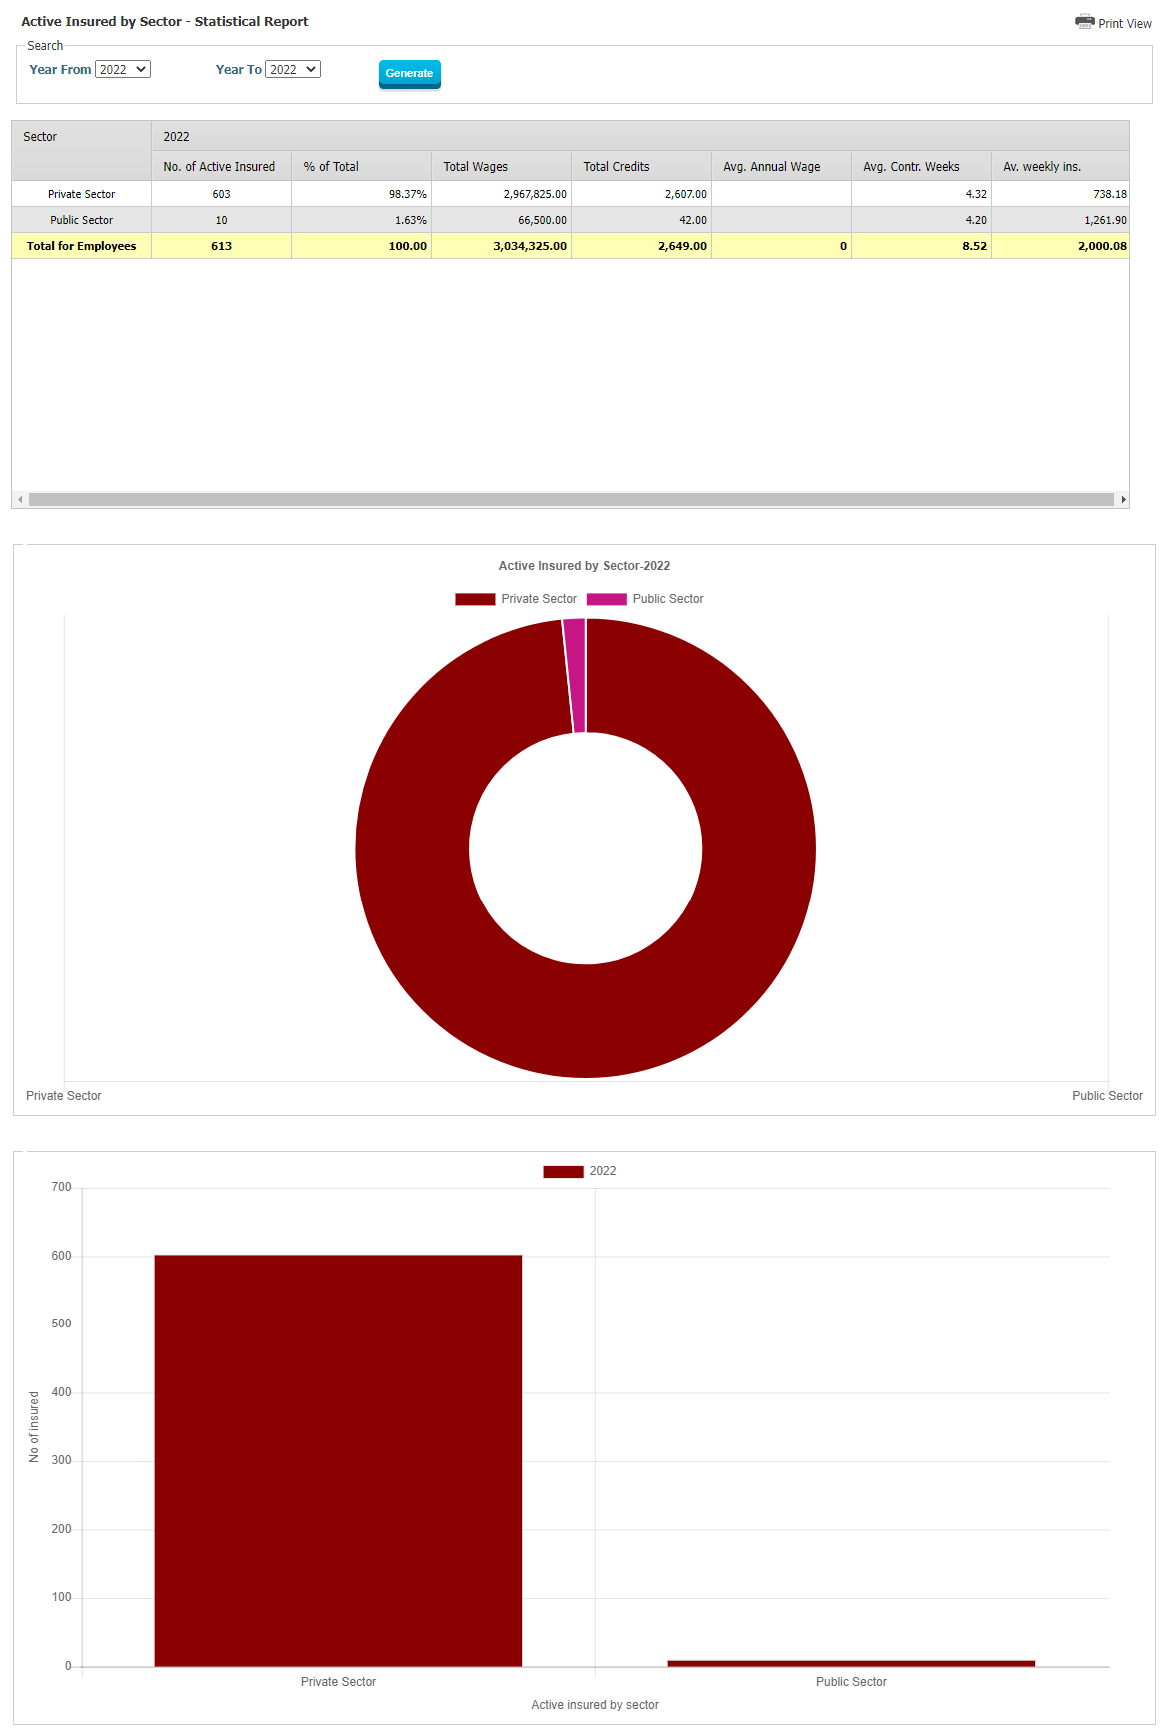
Figure 8: Statistical Reports – Active Insured by Sector – Statistical Report
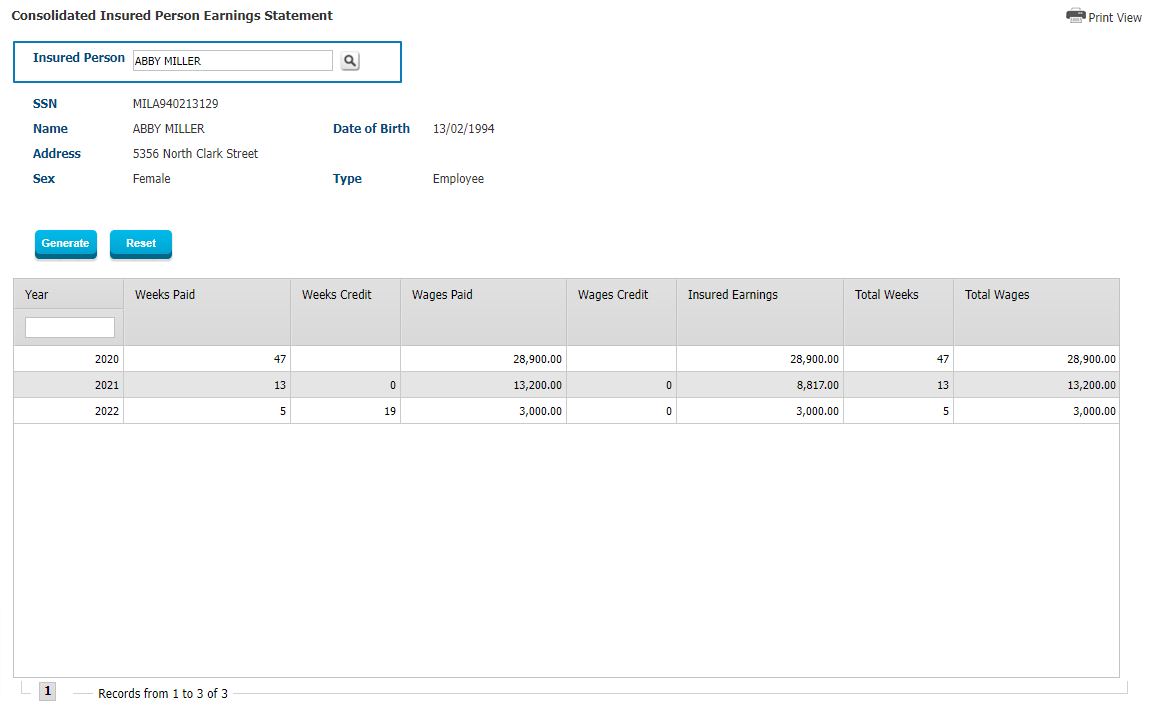
Figure 9: Legal, Arrears and Compliance Reports – Consolidated Insured Person Earnings Statement
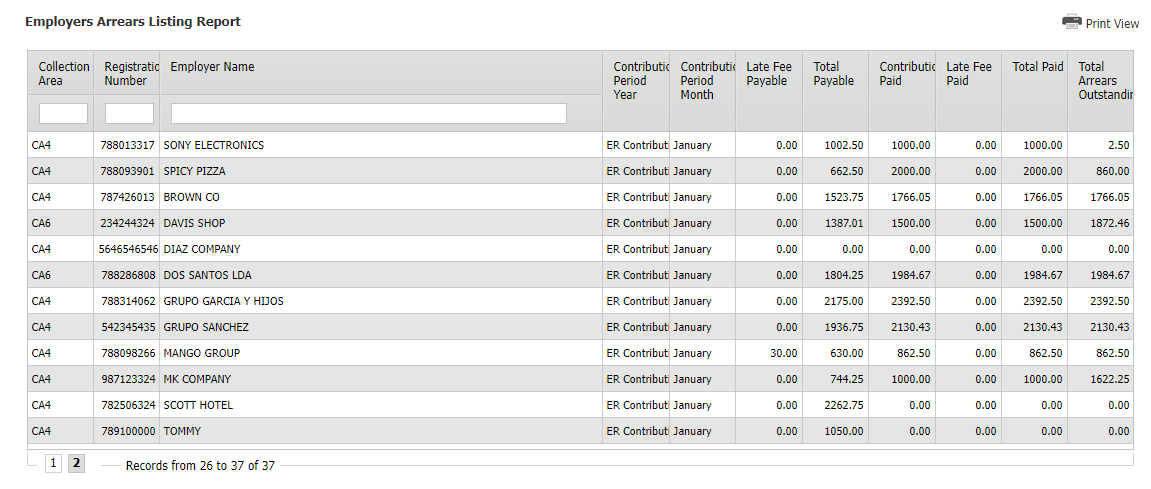
Figure 10: Legal, Arrears and Compliance Reports – Employers Arrears Listing Report